
svgViewR
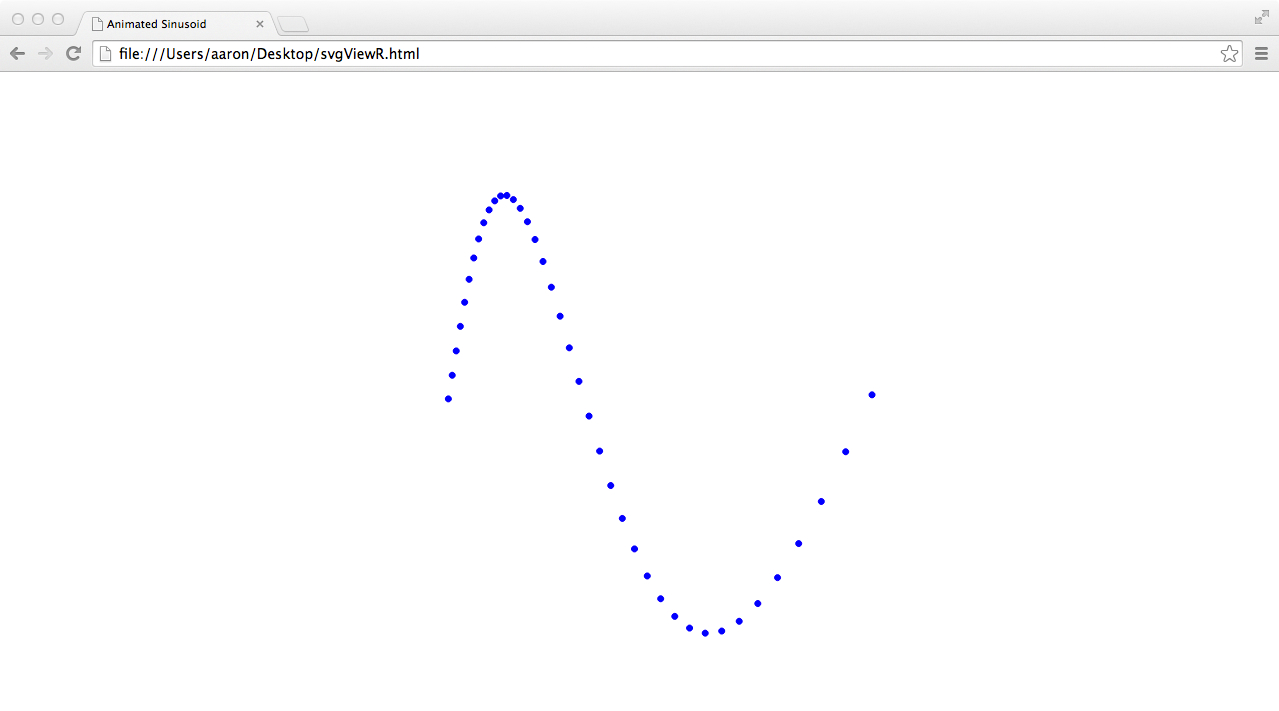
'Animated sinusoid' example in svgViewR interactive 3D web viewer. See
svgViewR Interactive Commands
for instructions on how to zoom, rotate and translate shapes.
svgViewR currently supports the plotting of points, lines and paths using functions similar to the native plotting functions in R. The interactive visualization is saved as a single '.html' file that can be opened with any compatible web browser (Safari, Firefox, Chrome, Opera). Interactivity and animations are achieved using standard Cascading Style Sheets (CSS), JavaScript, and Scalable Vector Graphics (SVG) code; no additional drivers, software or add-ons are required. See svgViewR Interactive Commands for instructions on how to zoom, rotate and translate shapes.