11 Align bilateral landmarks
The 3D shape data produced so far have an entirely arbitrary orientation in 3D space. For subsequent analyses this shouldn't make a difference but for visualization purposes it can be useful to place the shape data in a consistent orientation. If you have bilateral shape data (left/right), you can align the shapes to the midline plane such that all points at the midline will have z-values of 0. This section will show you how to use the StereoMorph function alignShapesToMidline() to align landmarks and curves to the midline plane.
If you'd like to try using alignShapesToMidline() with an example dataset you can download this stereo landmark and curve set (10 KB). Unzip the folder's contents into your current R working directory.
1. Begin by loading the StereoMorph library.
# Load the StereoMorph package
library(StereoMorph)
As with reflecting missing landmarks, in order for alignShapesToMidline() to recognize which landmarks are left, right, or on the midline, your landmark names will have to follow a particular convention. Landmark names that are right or left should end in "_" followed by either "R" or "L". Capitalization doesn't matter, so "r" or "l" will also work. These can be followed by numbers (e.g. for curve points) but should not be followed by other letters. All landmarks that don't have these endings will be treated as midline landmarks. For example, here are examples of acceptable landmark names to indicate a side:
jugal_upperbeak_L
jugal_upperbeak_r
jugal_upperbeak_R0202
- shapes: the shape data to be aligned
- file: where the aligned shapes should be saved
These two inputs also allow quite a bit of flexibility. For instance, the function call to align shapes for one 3D shape file looks like this:
# Align shapes to midline
asm <- alignShapesToMidline(shapes='Reflected/bubo_virginianus_FMNH488595.txt',
   file='Aligned/bubo_virginianus_FMNH488595.txt')
If the input to alignShapesToMidline() is a single set of shapes, the function will output the aligned shape data as a shape data structure. As shown in Reading shape data, you can access the reflected landmarks using the "$" operator:
# Print landmarks
asm$landmarks
Note that if you want all of your midline landmarks to have 0 z-values, you'll need to run reflection with average set to TRUE.
3. You can run alignShapesToMidline() over multiple files at once by making shapes and file vectors of corresponding file paths:
# Specify multiple specimens
specimen <- c('bubo_virginianus_FMNH488595.txt',
     'psittacus_erithacus_FMNH312899_a1.txt')

# Align shapes to midline
asm <- alignShapesToMidline(shapes=paste0('Reflected/', specimen),
   file=paste0('Aligned/', specimen))
Currently, for this input type the function returns NULL.
4. To run alignShapesToMidline() over all the files in a particular folder, use paths to folders as input rather than to particular files. If a folder input to file doesn't exist then one will be created.
# Align shapes to midline
asm <- alignShapesToMidline(shapes='Reflected', file='Aligned')
5. You can also input a shape structure rather than a shape file.
# Read shapes
shapes <- readShapes(file='Reflected/bubo_virginianus_FMNH488595.txt')

# Align shapes to midline
asm <- alignShapesToMidline(shapes=shapes)
Note that file can be omitted, in which case the function will not create a file for the aligned shape data and will only return a shapes list. file can only be omitted for single shape set input to alignShapesToMidline().
7. Lastly, print.progress can be set to TRUE in order to view the alignment errors:
# Align shapes to midline and print error summary
asm <- alignShapesToMidline(shapes=shapes, print.progress=TRUE)
The printed errors are the distance of the midline points from the midline. If you've previously reflected the shape data with average set to TRUE all of these errors will be zero since all midline points will be aligned perfectly with the midline.
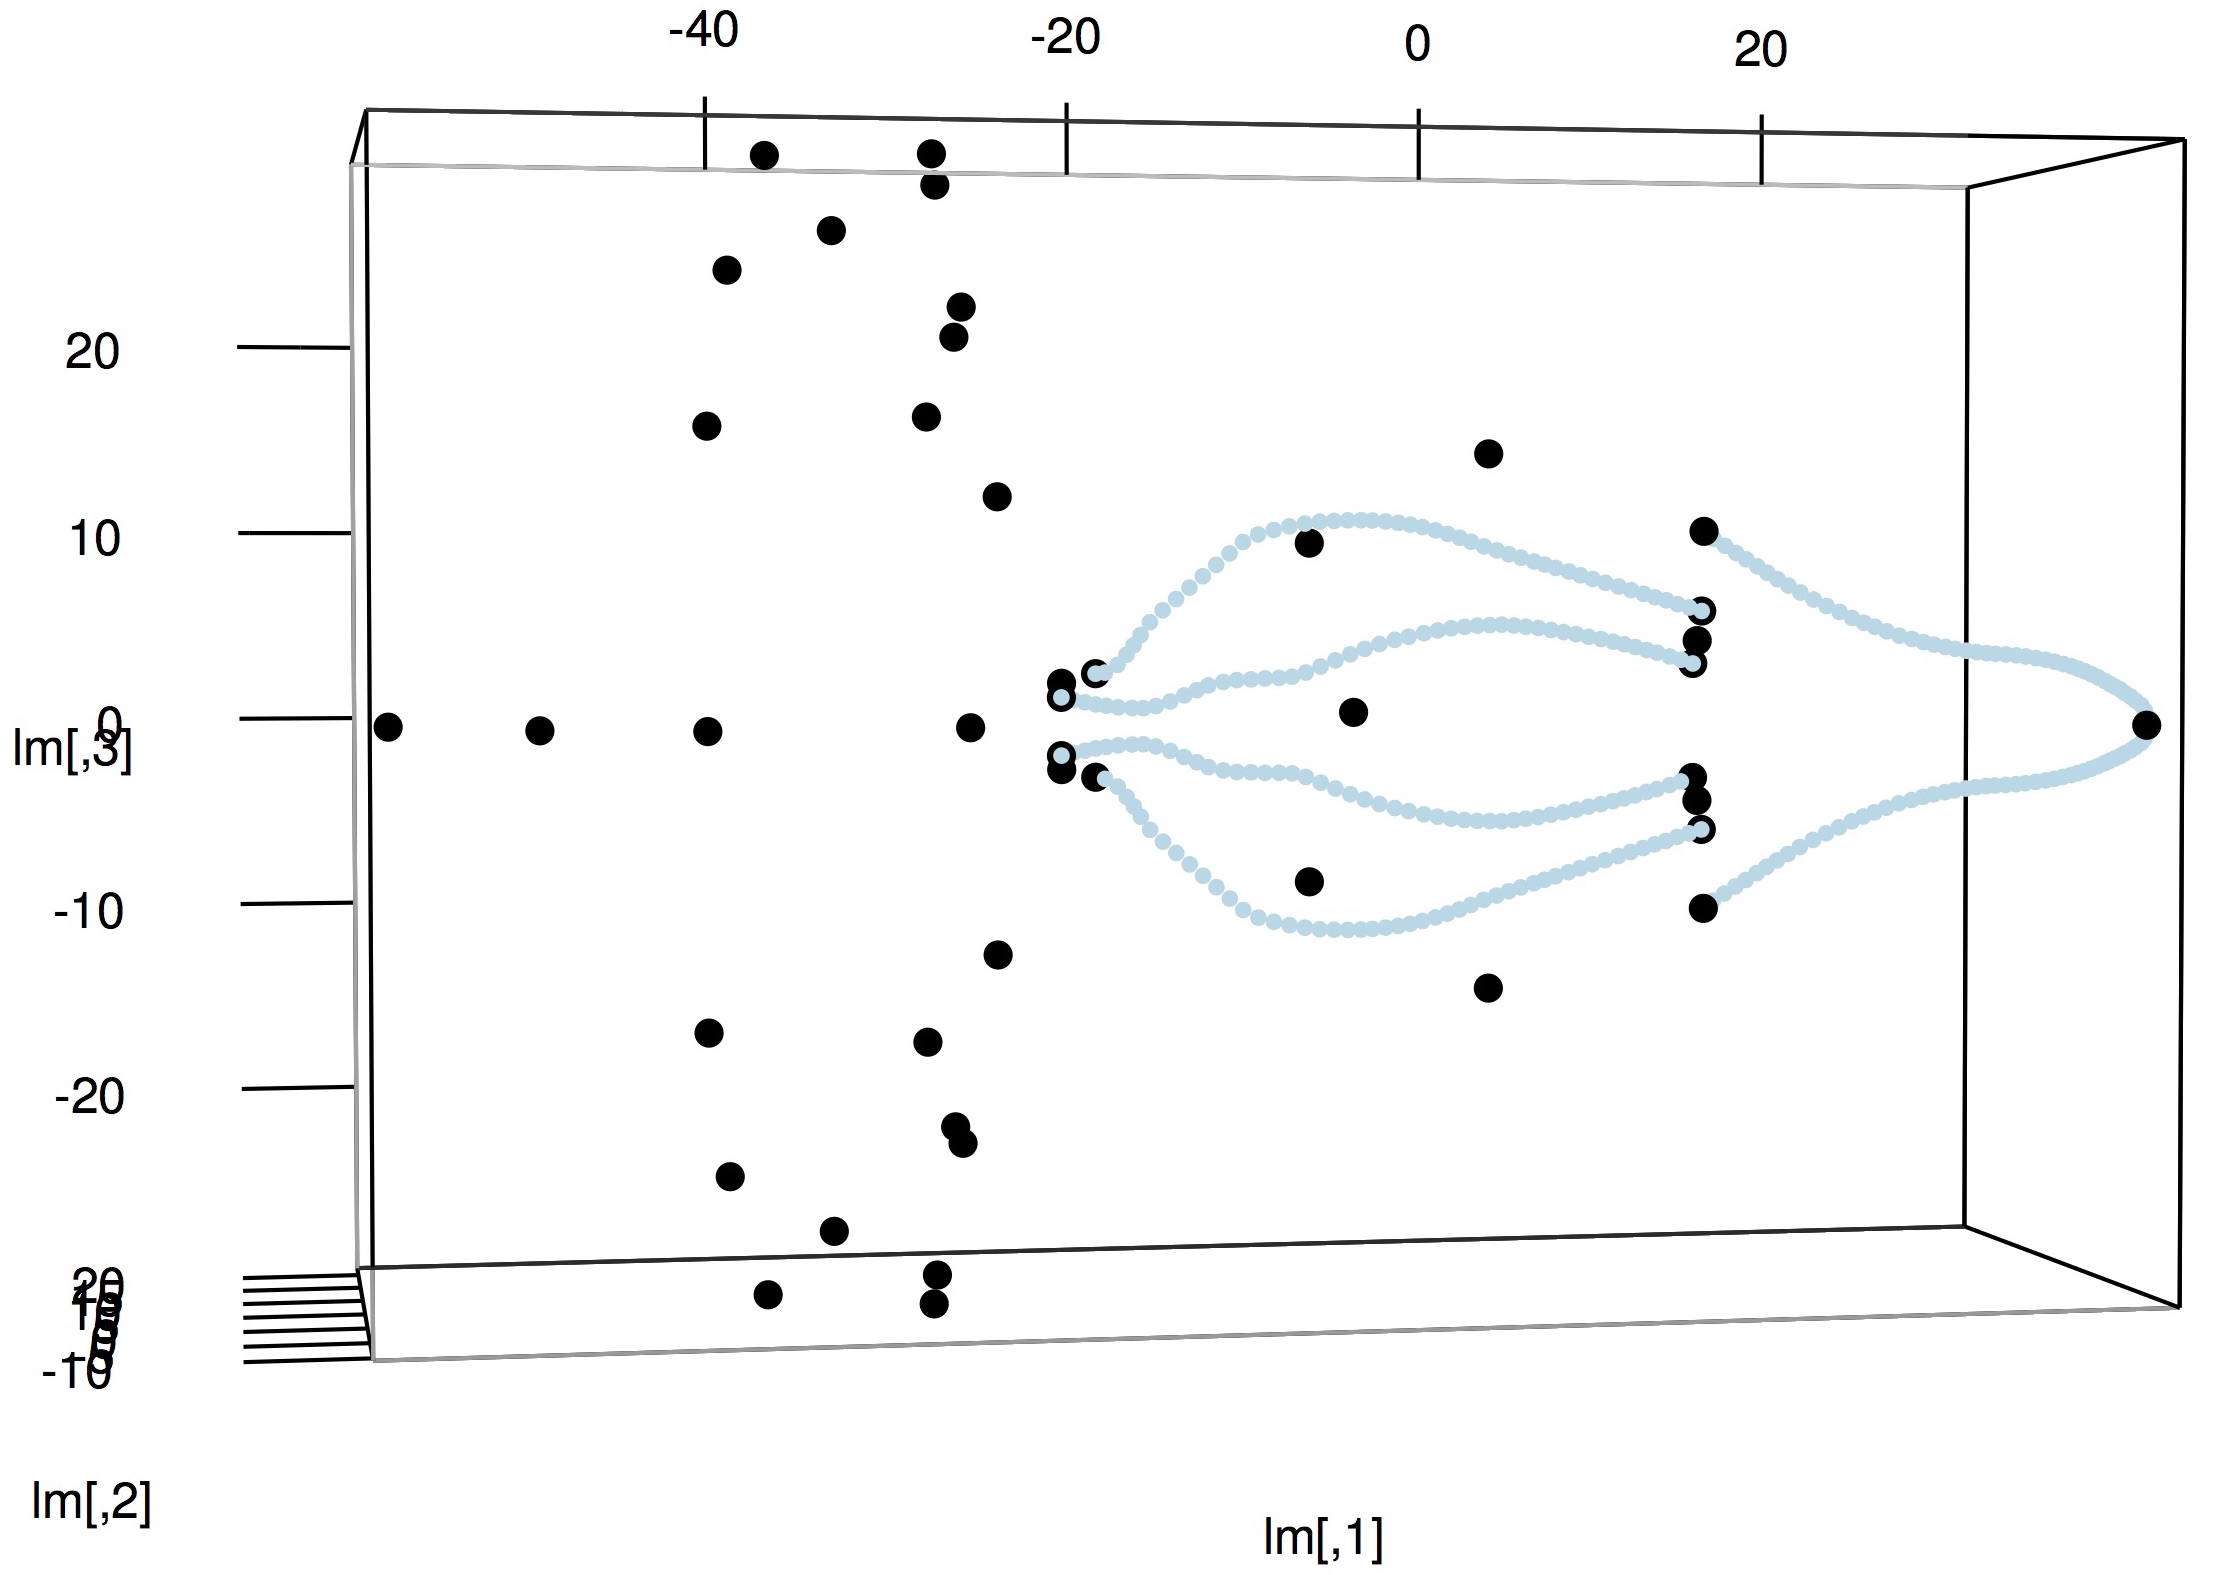
8. To visualize the aligned shape data, you can use the plot3d() function as shown previously in Visualizing shape data.
# Load the rgl package
library(rgl)

# Read shapes
shapes <- readShapes(file='Aligned/bubo_virginianus_FMNH488595.txt')

# Get landmarks
lm <- shapes$landmarks

# Set landmark range
r <- apply(lm, 2, 'max') - apply(lm, 2, 'min')

# Plot landmarks
plot3d(lm, aspect=c(r/r[3]), size=7)

# Plot curves
lapply(shapes$curves, plot3d, size=4, col='lightblue', add=TRUE)